PCB Test & Measurement Seite 147
Hinweis: Dies ist eine maschinenlesbare No-Flash Ansicht.Klicken Sie hier um zur Online-Version zu gelangen.
Inhalt
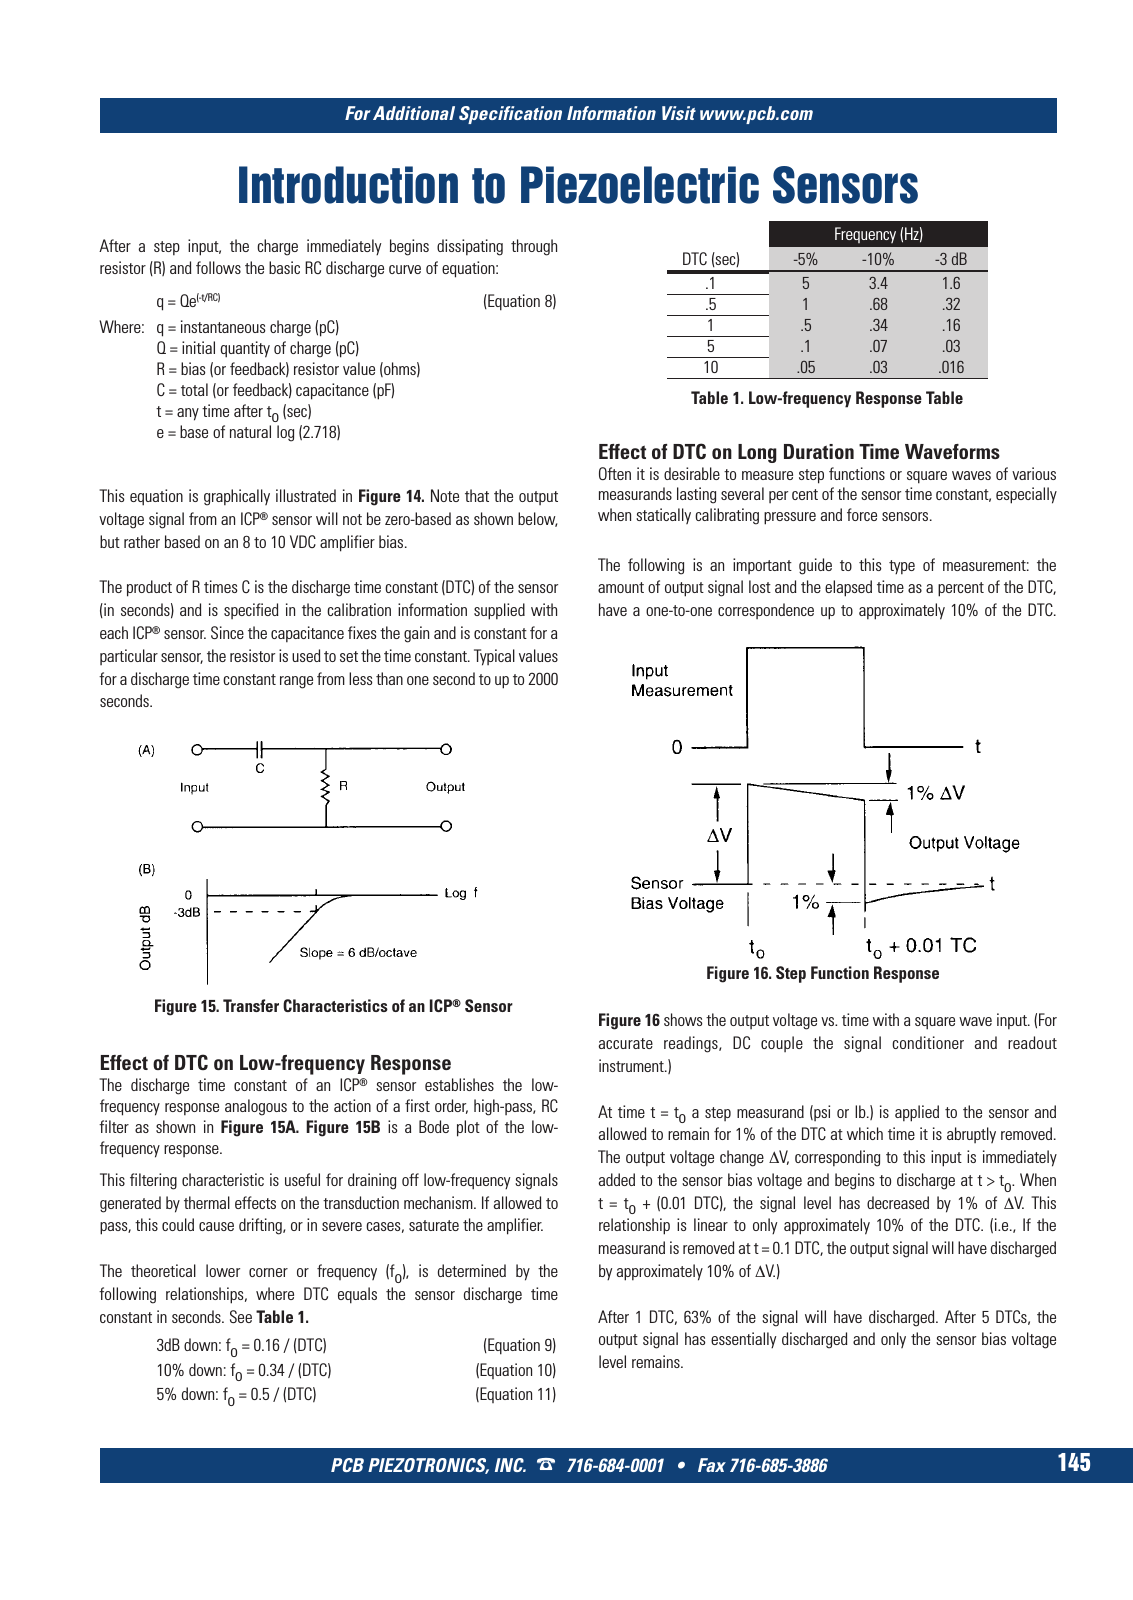
For Additional Specification Information Visit www pcb com PCB PIEZOTRONICS INC 716 684 0001 Fax 716 685 3886 145 Introduction to Piezoelectric Sensors After a step input the charge immediately begins dissipating through resistor R and follows the basic RC discharge curve of equation q Qe t RC Equation 8 Where q instantaneous charge pC Q initial quantity of charge pC R bias or feedback resistor value ohms C total or feedback capacitance pF t any time after to sec e base of natural log 2 718 This equation is graphically illustrated in Figure 14 Note that the output voltage signal from an ICP sensor will not be zero based as shown below but rather based on an 8 to 10 VDC amplifier bias The product of R times C is the discharge time constant DTC of the sensor in seconds and is specified in the calibration information supplied with each ICP sensor Since the capacitance fixes the gain and is constant for a particular sensor the resistor is used to set the time constant Typical values for a discharge time constant range from less than one second to up to 2000 seconds Effect of DTC on Low frequency Response The discharge time constant of an ICP sensor establishes the low frequency response analogous to the action of a first order high pass RC filter as shown in Figure 15A Figure 15B is a Bode plot of the low frequency response This filtering characteristic is useful for draining off low frequency signals generated by thermal effects on the transduction mechanism If allowed to pass this could cause drifting or in severe cases saturate the amplifier The theoretical lower corner or frequency fo is determined by the following relationships where DTC equals the sensor discharge time constant in seconds See Table 1 3dB down fo 0 16 DTC Equation 9 10 down fo 0 34 DTC Equation 10 5 down fo 0 5 DTC Equation 11 Frequency Hz DTC sec 5 10 3 dB 1 5 3 4 1 6 5 1 68 32 1 5 34 16 5 1 07 03 10 05 03 016 Table 1 Low frequency Response Table Effect of DTC on Long Duration Time Waveforms Often it is desirable to measure step functions or square waves of various measurands lasting several per cent of the sensor time constant especially when statically calibrating pressure and force sensors The following is an important guide to this type of measurement the amount of output signal lost and the elapsed time as a percent of the DTC have a one to one correspondence up to approximately 10 of the DTC Figure 16 shows the output voltage vs time with a square wave input For accurate readings DC couple the signal conditioner and readout instrument At time t to a step measurand psi or lb is applied to the sensor and allowed to remain for 1 of the DTC at which time it is abruptly removed The output voltage change ΔV corresponding to this input is immediately added to the sensor bias voltage and begins to discharge at t to When t to 0 01 DTC the signal level has decreased by 1 of ΔV This relationship is linear to only approximately 10 of the DTC i e If the measurand is removed at t 0 1 DTC the output signal will have discharged by approximately 10 of ΔV After 1 DTC 63 of the signal will have discharged After 5 DTCs the output signal has essentially discharged and only the sensor bias voltage level remains Figure 16 Step Function Response Figure 15 Transfer Characteristics of an ICP Sensor 9 T Mcatalog 2011 Seite 125 166 SYN G500 21 04 11 18 04 Seite 151