PCB Test & Measurement Seite 144
Hinweis: Dies ist eine maschinenlesbare No-Flash Ansicht.Klicken Sie hier um zur Online-Version zu gelangen.
Inhalt
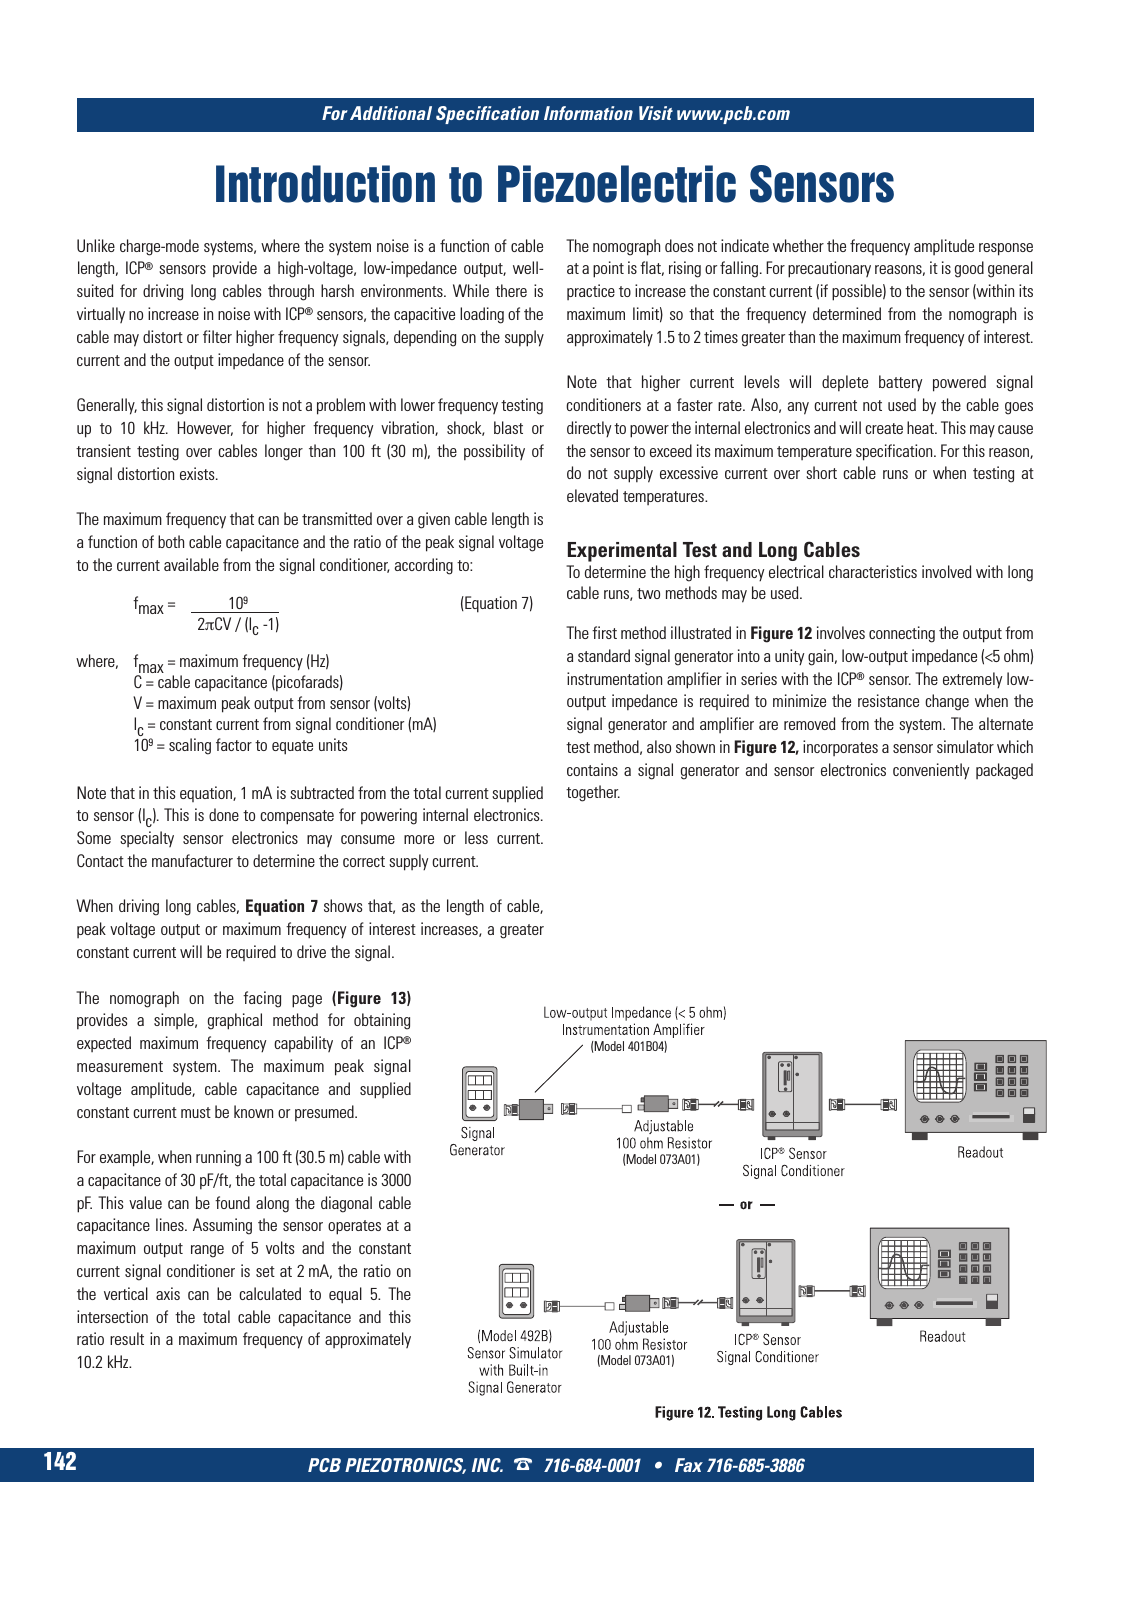
PCB PIEZOTRONICS INC 716 684 0001 Fax 716 685 3886 For Additional Specification Information Visit www pcb com 142 Introduction to Piezoelectric Sensors Unlike charge mode systems where the system noise is a function of cable length ICP sensors provide a high voltage low impedance output well suited for driving long cables through harsh environments While there is virtually no increase in noise with ICP sensors the capacitive loading of the cable may distort or filter higher frequency signals depending on the supply current and the output impedance of the sensor Generally this signal distortion is not a problem with lower frequency testing up to 10 kHz However for higher frequency vibration shock blast or transient testing over cables longer than 100 ft 30 m the possibility of signal distortion exists The maximum frequency that can be transmitted over a given cable length is a function of both cable capacitance and the ratio of the peak signal voltage to the current available from the signal conditioner according to fmax 109 Equation 7 2πCV lc 1 where fmax maximum frequency Hz C cable capacitance picofarads V maximum peak output from sensor volts lc constant current from signal conditioner mA 109 scaling factor to equate units Note that in this equation 1 mA is subtracted from the total current supplied to sensor lc This is done to compensate for powering internal electronics Some specialty sensor electronics may consume more or less current Contact the manufacturer to determine the correct supply current When driving long cables Equation 7 shows that as the length of cable peak voltage output or maximum frequency of interest increases a greater constant current will be required to drive the signal The nomograph on the facing page Figure 13 provides a simple graphical method for obtaining expected maximum frequency capability of an ICP measurement system The maximum peak signal voltage amplitude cable capacitance and supplied constant current must be known or presumed For example when running a 100 ft 30 5 m cable with a capacitance of 30 pF ft the total capacitance is 3000 pF This value can be found along the diagonal cable capacitance lines Assuming the sensor operates at a maximum output range of 5 volts and the constant current signal conditioner is set at 2 mA the ratio on the vertical axis can be calculated to equal 5 The intersection of the total cable capacitance and this ratio result in a maximum frequency of approximately 10 2 kHz The nomograph does not indicate whether the frequency amplitude response at a point is flat rising or falling For precautionary reasons it is good general practice to increase the constant current if possible to the sensor within its maximum limit so that the frequency determined from the nomograph is approximately 1 5 to 2 times greater than the maximum frequency of interest Note that higher current levels will deplete battery powered signal conditioners at a faster rate Also any current not used by the cable goes directly to power the internal electronics and will create heat This may cause the sensor to exceed its maximum temperature specification For this reason do not supply excessive current over short cable runs or when testing at elevated temperatures Experimental Test and Long Cables To determine the high frequency electrical characteristics involved with long cable runs two methods may be used The first method illustrated in Figure 12 involves connecting the output from a standard signal generator into a unity gain low output impedance 5 ohm instrumentation amplifier in series with the ICP sensor The extremely low output impedance is required to minimize the resistance change when the signal generator and amplifier are removed from the system The alternate test method also shown in Figure 12 incorporates a sensor simulator which contains a signal generator and sensor electronics conveniently packaged together Model 401B04 Model 073A01 Model 073A01 9 T Mcatalog 2011 Seite 125 166 SYN G500 21 04 11 18 04 Seite 148