PCB Test & Measurement Seite 142
Hinweis: Dies ist eine maschinenlesbare No-Flash Ansicht.Klicken Sie hier um zur Online-Version zu gelangen.
Inhalt
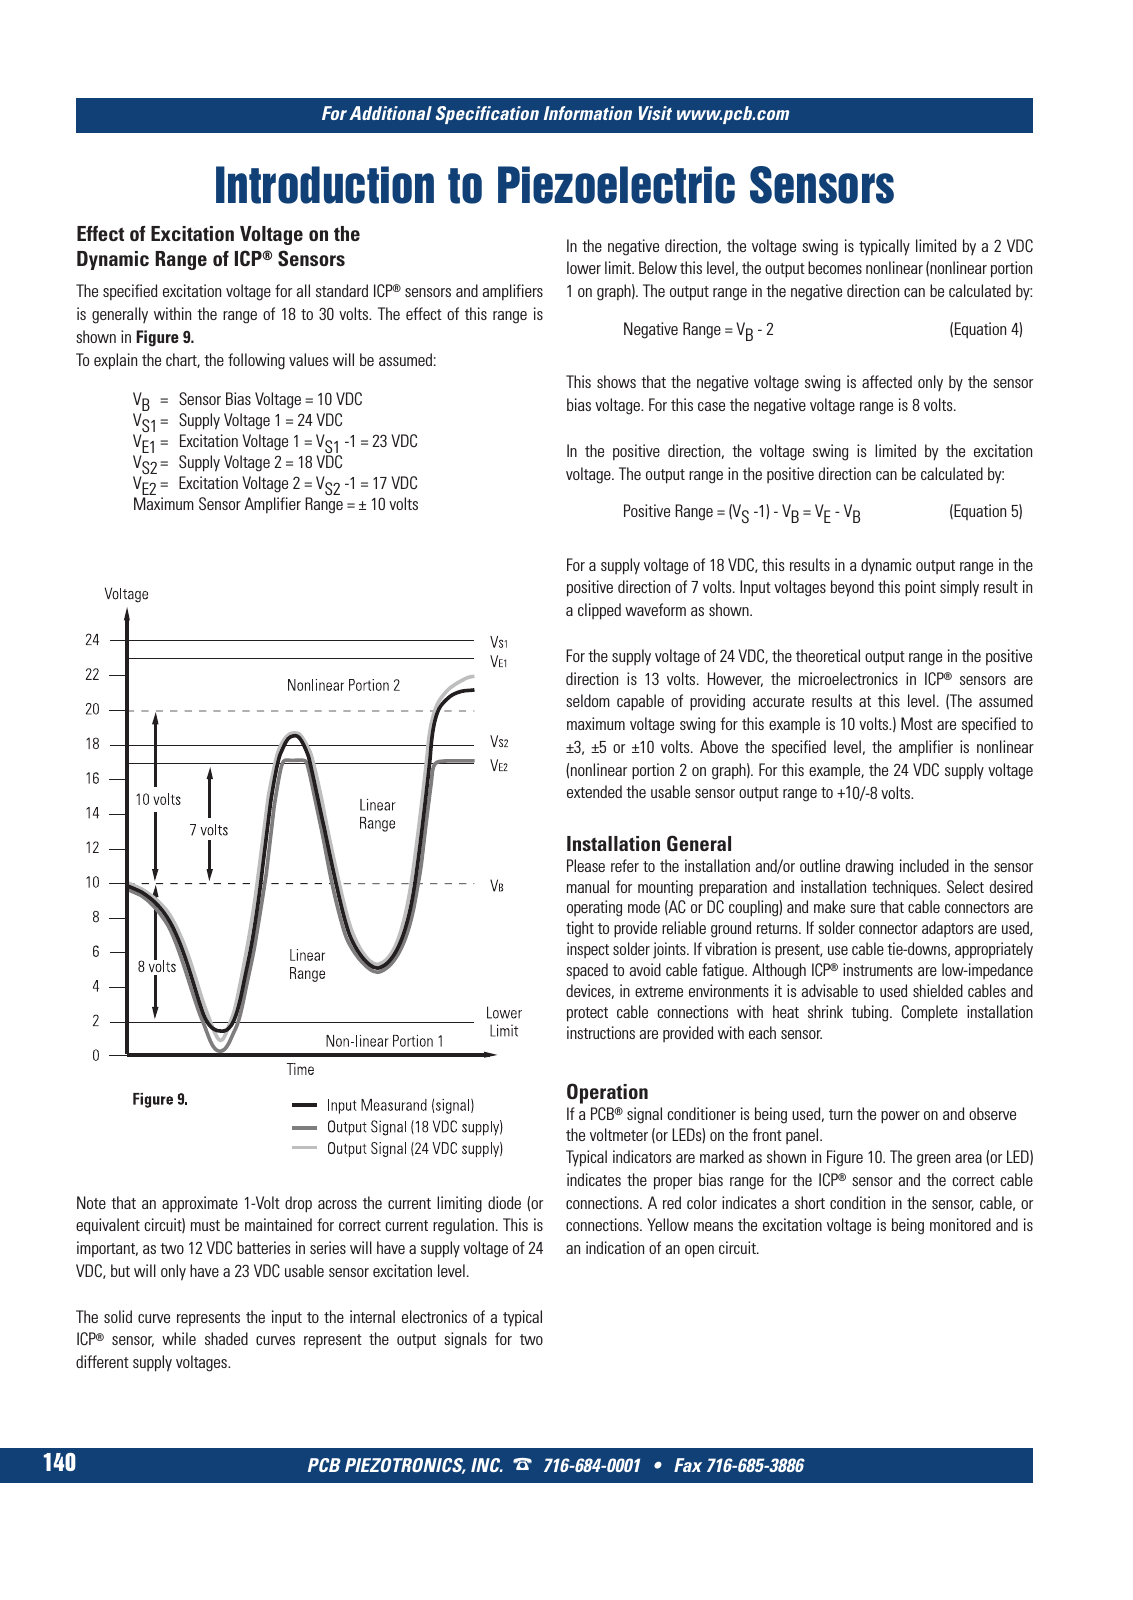
PCB PIEZOTRONICS INC 716 684 0001 Fax 716 685 3886 For Additional Specification Information Visit www pcb com 140 Introduction to Piezoelectric Sensors Effect of Excitation Voltage on the Dynamic Range of ICP Sensors The specified excitation voltage for all standard ICP sensors and amplifiers is generally within the range of 18 to 30 volts The effect of this range is shown in Figure 9 To explain the chart the following values will be assumed VB Sensor Bias Voltage 10 VDC VS1 Supply Voltage 1 24 VDC VE1 Excitation Voltage 1 VS1 1 23 VDC VS2 Supply Voltage 2 18 VDC VE2 Excitation Voltage 2 VS2 1 17 VDC Maximum Sensor Amplifier Range 10 volts Note that an approximate 1 Volt drop across the current limiting diode or equivalent circuit must be maintained for correct current regulation This is important as two 12 VDC batteries in series will have a supply voltage of 24 VDC but will only have a 23 VDC usable sensor excitation level The solid curve represents the input to the internal electronics of a typical ICP sensor while shaded curves represent the output signals for two different supply voltages In the negative direction the voltage swing is typically limited by a 2 VDC lower limit Below this level the output becomes nonlinear nonlinear portion 1 on graph The output range in the negative direction can be calculated by Negative Range VB 2 Equation 4 This shows that the negative voltage swing is affected only by the sensor bias voltage For this case the negative voltage range is 8 volts In the positive direction the voltage swing is limited by the excitation voltage The output range in the positive direction can be calculated by Positive Range VS 1 VB VE VB Equation 5 For a supply voltage of 18 VDC this results in a dynamic output range in the positive direction of 7 volts Input voltages beyond this point simply result in a clipped waveform as shown For the supply voltage of 24 VDC the theoretical output range in the positive direction is 13 volts However the microelectronics in ICP sensors are seldom capable of providing accurate results at this level The assumed maximum voltage swing for this example is 10 volts Most are specified to 3 5 or 10 volts Above the specified level the amplifier is nonlinear nonlinear portion 2 on graph For this example the 24 VDC supply voltage extended the usable sensor output range to 10 8 volts Installation General Please refer to the installation and or outline drawing included in the sensor manual for mounting preparation and installation techniques Select desired operating mode AC or DC coupling and make sure that cable connectors are tight to provide reliable ground returns If solder connector adaptors are used inspect solder joints If vibration is present use cable tie downs appropriately spaced to avoid cable fatigue Although ICP instruments are low impedance devices in extreme environments it is advisable to used shielded cables and protect cable connections with heat shrink tubing Complete installation instructions are provided with each sensor Operation If a PCB signal conditioner is being used turn the power on and observe the voltmeter or LEDs on the front panel Typical indicators are marked as shown in Figure 10 The green area or LED indicates the proper bias range for the ICP sensor and the correct cable connections A red color indicates a short condition in the sensor cable or connections Yellow means the excitation voltage is being monitored and is an indication of an open circuit 9 T Mcatalog 2011 Seite 125 166 SYN G500 21 04 11 18 04 Seite 146